Diagrams
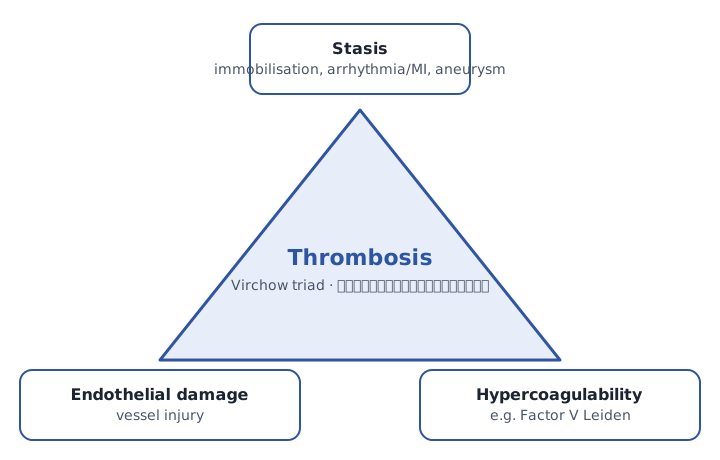
D1
Virchow triad triangle with surgical examples at each corner.
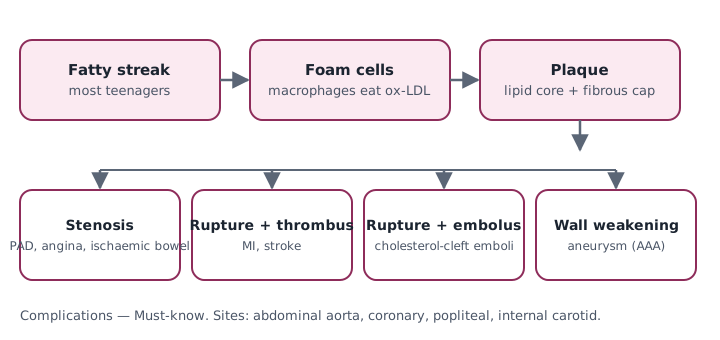
D2
Atherosclerosis timeline: fatty streak → foam cell → plaque → rupture/thrombus/embolus/aneurysm.
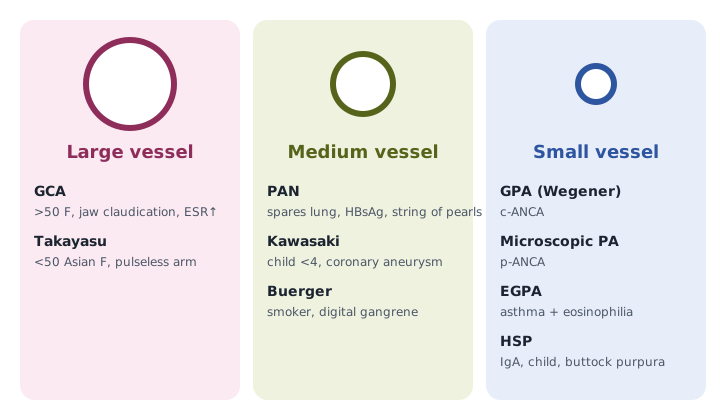
D3
Vessel-size vasculitis map: large/medium/small with disease names + key clue.
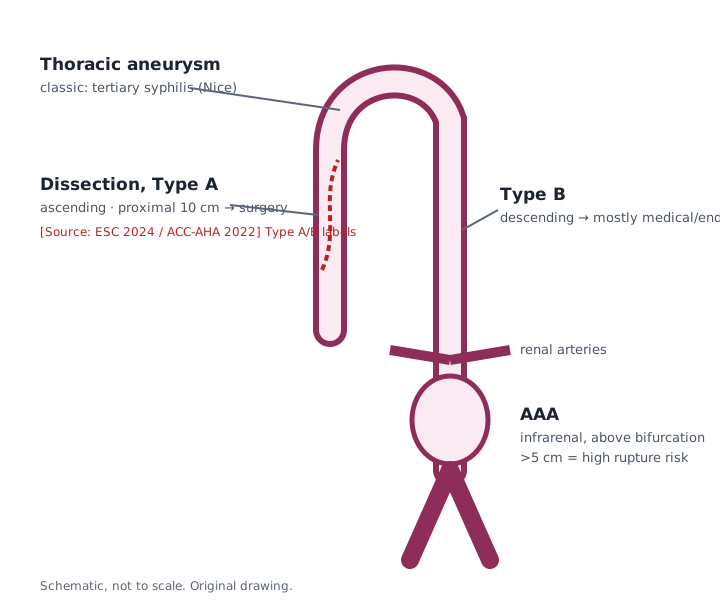
D4
Aorta outline showing infrarenal AAA, proximal dissection (Stanford A vs B), thoracic aneurysm.
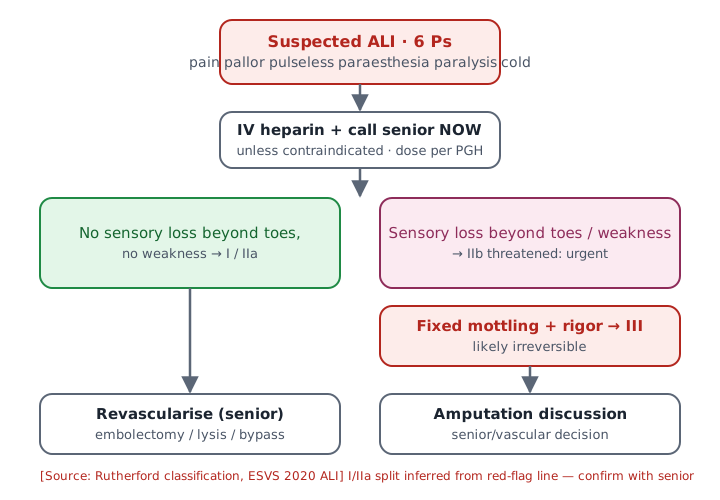
D5
ALI flowchart: 6 Ps → Rutherford I/IIa/IIb/III → heparin + call senior → revascularise / amputate.
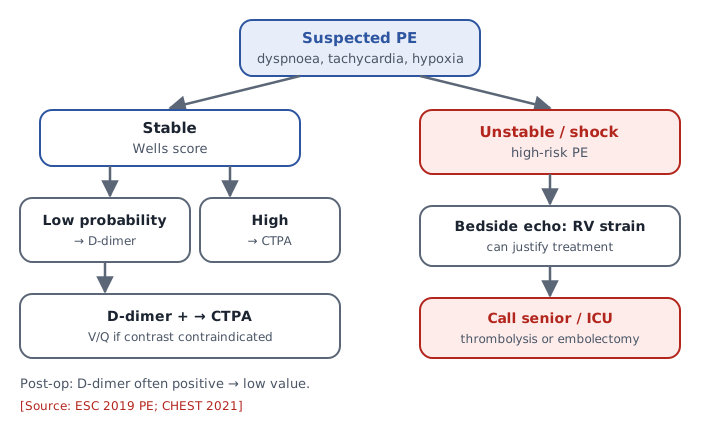
D6
PE work-up flow: Wells → D-dimer/CTPA → stable vs unstable branch.
D7
Embolus type table with icons (thrombus, cholesterol, fat, gas, amniotic).
D8
Renin-angiotensin loop in renal artery stenosis.
D9
Arteriolosclerosis comparison: hyaline vs hyperplastic vs Mönckeberg.
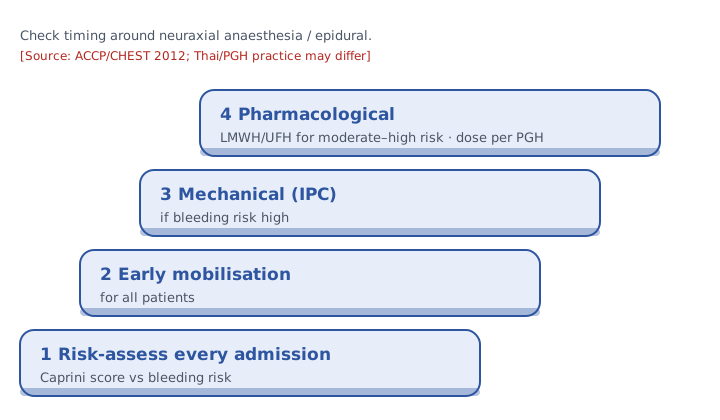
D10
Caprini/VTE prophylaxis decision ladder (mobilise → mechanical → pharmacological).